Please note: The Dashboard is only available for users with the ‘Dashboard’ permission enabled.
The Dashboard is the default landing page of MyTerminal. It provides an overview of important information and indicates whether actions are required. Which Dashboard sections are available depends on your permissions. Below are all Dashboard sections and if a section is only visible with a permission, this will be mentioned.
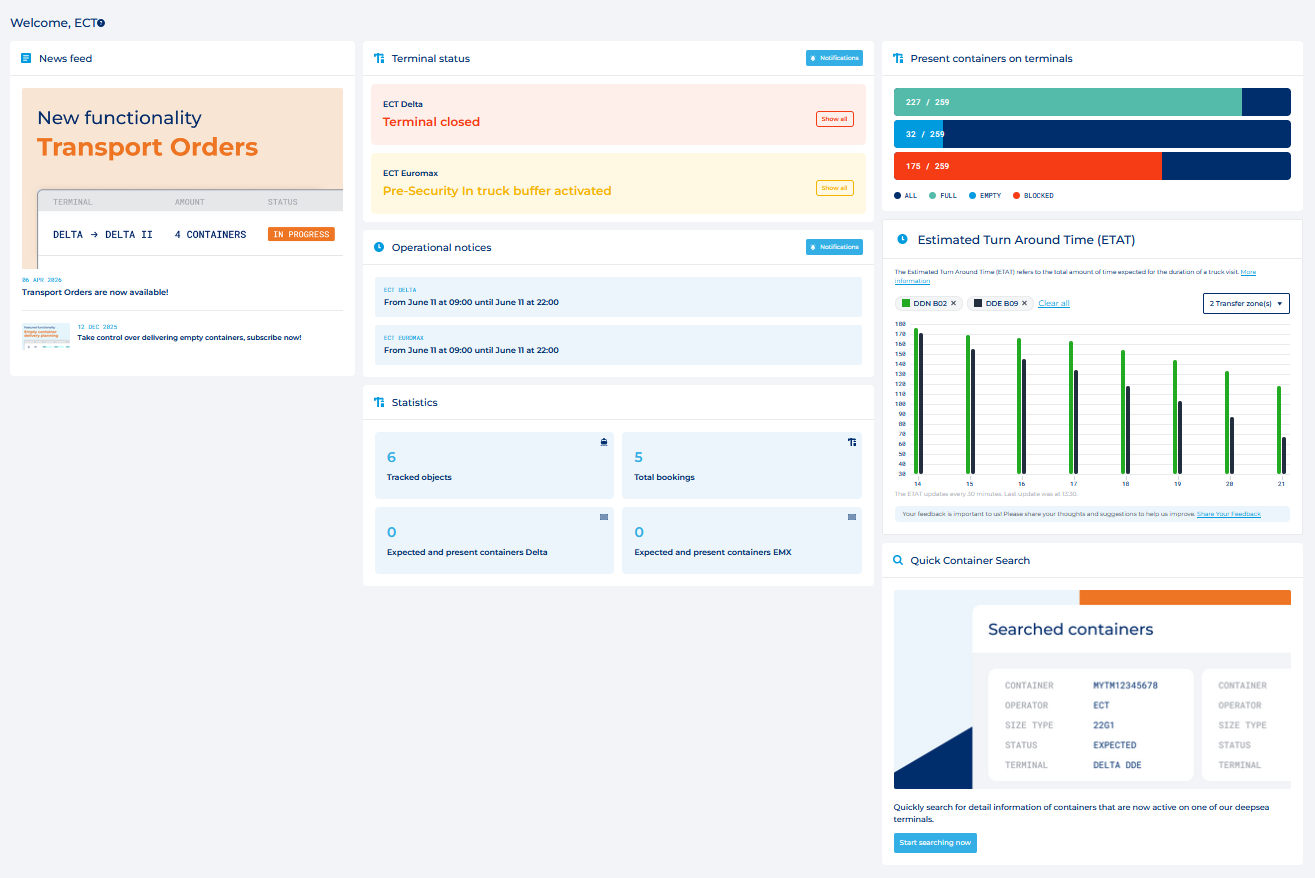
The news feed shows information about MyTerminal and ECT in general. Click on the news item to read the news article.

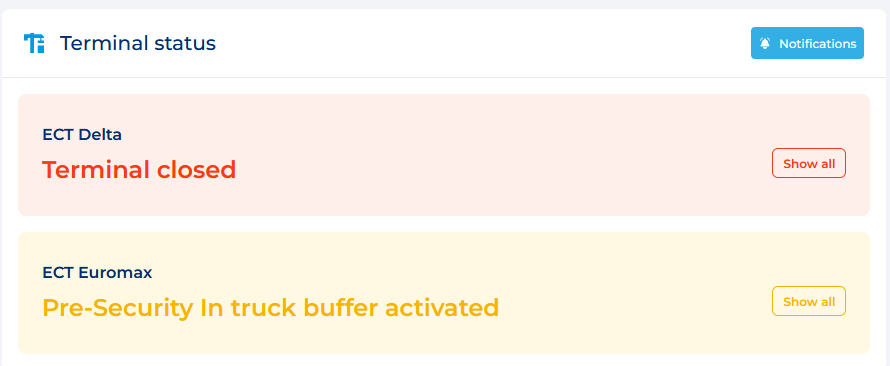
The Terminal Status section shows active and planned disruptions or maintenance on the ECT Terminals. Click on a terminal tile to see all the affected terminals, the causes and consequences.
Only available for users with the ‘MyContainers’ permission enabled. The ‘Present containers on terminals’ section displays the amount of present containers with your operator code that are Full, Empty, or Blocked. Click on one of the three items to start searching in My Containers.

Only available for users with the ‘MyContainers’ permission enabled. The ‘Present containers on terminals’ section displays the amount of present containers with your operator code that are Full, Empty, or Blocked. Click on one of the three items to start searching in My Containers.

To make it quicker and easier to find container information within MyTerminal, you can use Quick Container Search. For more information see the quick container search page.

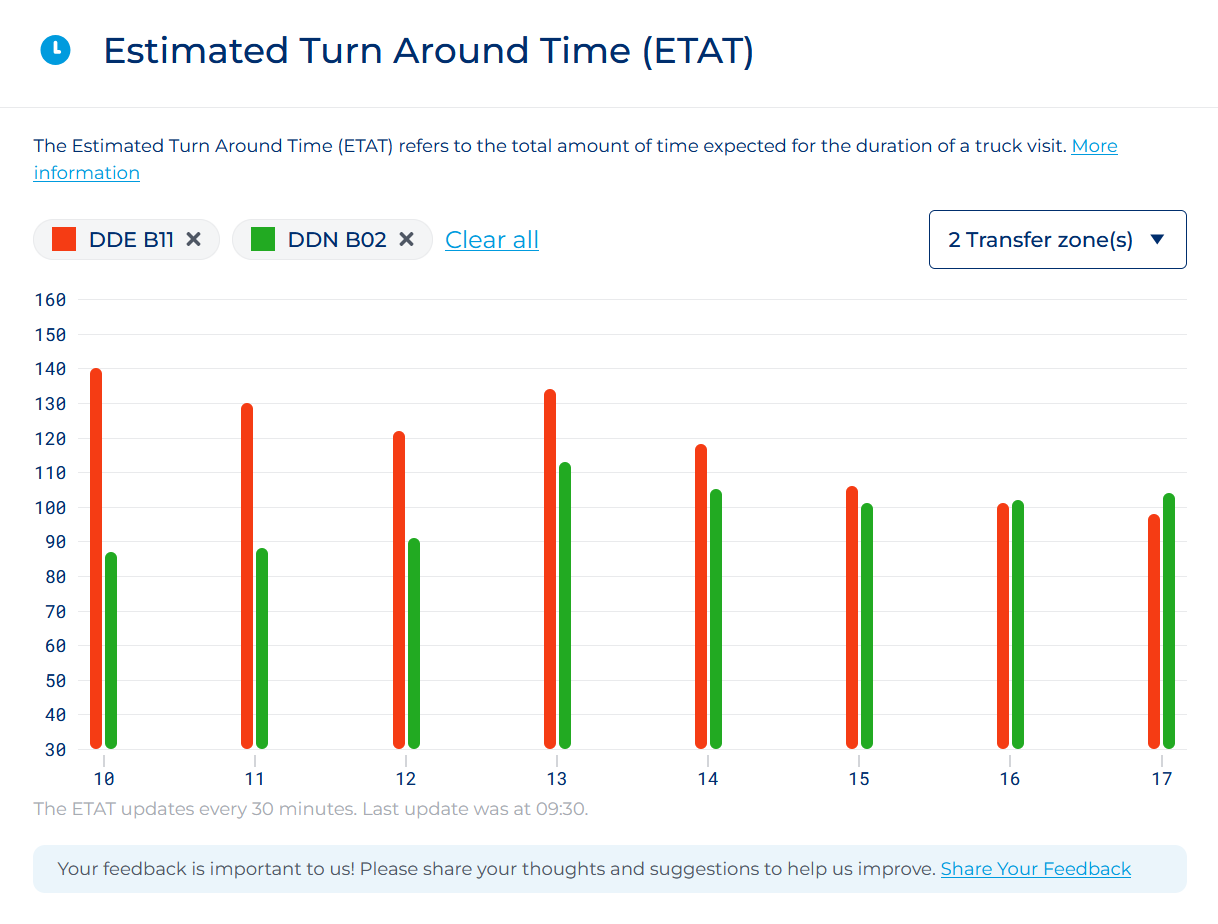
Only available for users with the ‘Terminal’ permission enabled. A clear and simple overview that grants insight in the amount of time it takes for a Terminal visit to be completed from security in to security out.